Food Inflation Hit 8.94 Per Cent in October. The Average Is Hiding the Split.
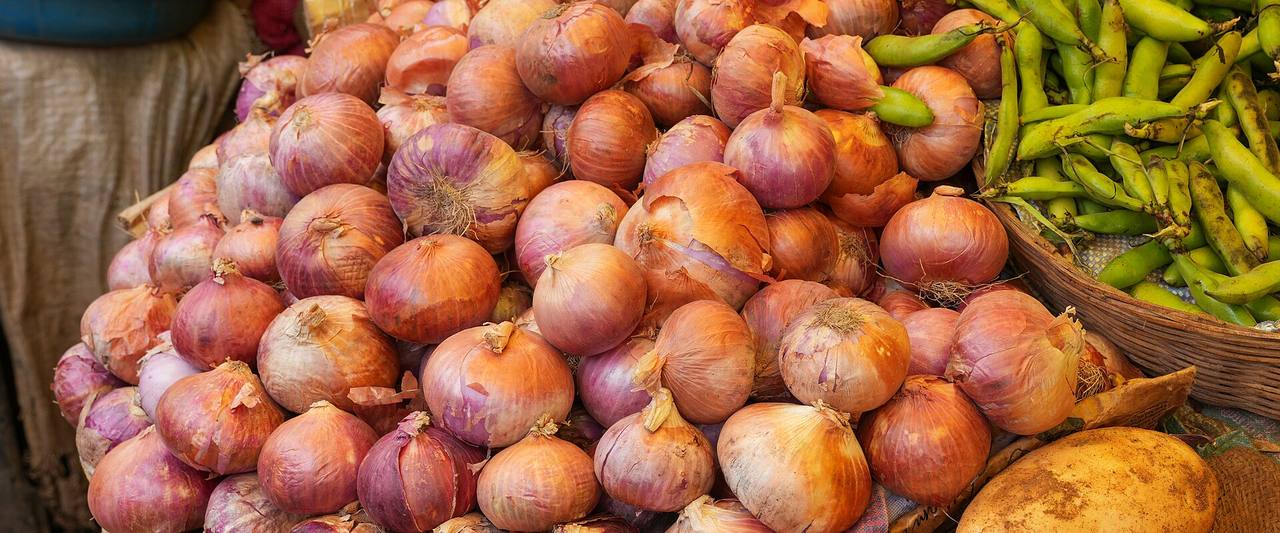
October's food inflation number is 8.94 per cent. Used on its own, it will misprice almost everything it touches. Inside that one average, onion prices more than doubled from a year earlier while potato prices fell by a seventh. A procurement budget, a credit review or a margin plan built on the average will be wrong in both directions at once — too calm about the lines that are actually moving, too alarmed about the lines that are not.
The headline crossed a line the food number crossed earlier
Retail inflation on the Consumer Price Index came in at 6.09 per cent in October, provisional, up from 5.54 per cent in September. Food inflation, on the Consumer Food Price Index, reached 8.94 per cent, up from 7.74 per cent a month earlier. The gap between the two — nearly three points — is the story. October was not a month in which everything got dearer. It was a month in which food pulled away from the rest of the basket.
The combined reading also moved past the upper tolerance limit of the Reserve Bank's framework — a 4 per cent target with a band of 2 to 6 per cent — and BusinessLine notes it is the highest reading since October 2024, when inflation stood at 6.21 per cent. One month above 6 per cent is not, by itself, a failure of that framework, which is judged on averages over quarters. It is, however, the first monthly print in two years that sits outside the band, and it arrived while food was still accelerating.
Rural buyers are carrying the larger share
The split is geographic as well as culinary. Rural inflation was 6.63 per cent in October against 5.41 per cent in urban areas, and rural food inflation ran at 9.09 per cent against 8.68 per cent urban. Food and beverages carry a weight of 36.75 in the combined index, so a rural household budget feels this print more directly than the headline suggests. Among larger states, headline inflation was highest in Tamil Nadu at 7.29 per cent, Telangana at 7.26, Andhra Pradesh at 7.25, Madhya Pradesh at 7.19 and Odisha at 7.17 — a southern and central concentration that a national average smooths away.
For lenders, that geography matters more than the decimal. A rural book in a state printing above 7 per cent is facing a different household cash-flow squeeze than a book in a state printing near 5 per cent, even though both sit under the same national headline. Portfolio reviews that stop at 6.09 per cent will miss where repayment stress is actually building.
Five items up, five items down — and the average in between
The item table is where October stops looking like general inflation at all. At one end, onion inflation hit 116.22 per cent and garlic reached 60.74 per cent. At the other end, potato prices fell 14.24 per cent from a year earlier and cauliflower fell 10.57 per cent. These are year-on-year changes, not one-month jumps — but a spread of more than 130 points between two staples in the same basket is not a monetary phenomenon. It is a supply calendar showing up in the index.
| Item (all-India, combined) | Inflation, Sep 2026 (%) | Inflation, Oct 2026 (%) |
|---|---|---|
| Onion | 108.13 | 116.22 |
| Garlic | 54.62 | 60.74 |
| Ginger | 62.85 | 48.32 |
| Lemon | 36.41 | 47.30 |
| Potato | -11.52 | -14.24 |
| Cauliflower | -2.88 | -10.57 |
Year-on-year item inflation, Consumer Price Index (base 2024=100), October 2026 release. Source: National Statistics Office, MoSPI, 12 November 2026. Table by Farmioc.
Read that table as a buyer and the instruction is plain. Onion and garlic exposure cannot be budgeted off a food average that is twelve times smaller than the onion print itself; those lines need their own forward cover, their own supplier conversations, their own timing. Potato and cauliflower, meanwhile, are deflating — a buyer still paying last year's rates there is giving margin away. Ginger even moved the other way inside the month, easing from 62.85 to 48.32 per cent while lemon accelerated. Item by item is the only level at which this release is usable.
What the index can and cannot tell you
The October print rests on a full count, not a sample shortcut: price data were collected from 1,407 urban markets and 1,465 villages, with a 100 per cent response rate in both rural and urban markets. The ministry itself cautions that state-level item indices can rest on thin samples and should be used with care — a warning worth heeding before anyone trades on a single state's single item. The October figures are provisional; September's are final. The next release, for November, is due on 14 December 2026.
What to do with this
Three conclusions hold up. First, retire the single food-inflation assumption in procurement and credit models for this quarter; October's basket is at least two different markets. Second, weight the rural print, not the combined one, when stress-testing agricultural household exposure — 9.09 per cent rural food inflation is the number those borrowers are living with. Third, treat the onion-led spike as a supply question with a calendar attached, not as a reason to reprice everything: the same release that shows onion doubling shows potato deflating. Tracking that item-level split week by week, mandi by mandi, rather than release by release, is the work Farmioc's PriceHub is built for — so a buying or lending decision is made on the line that is actually moving, not on the average hiding it.