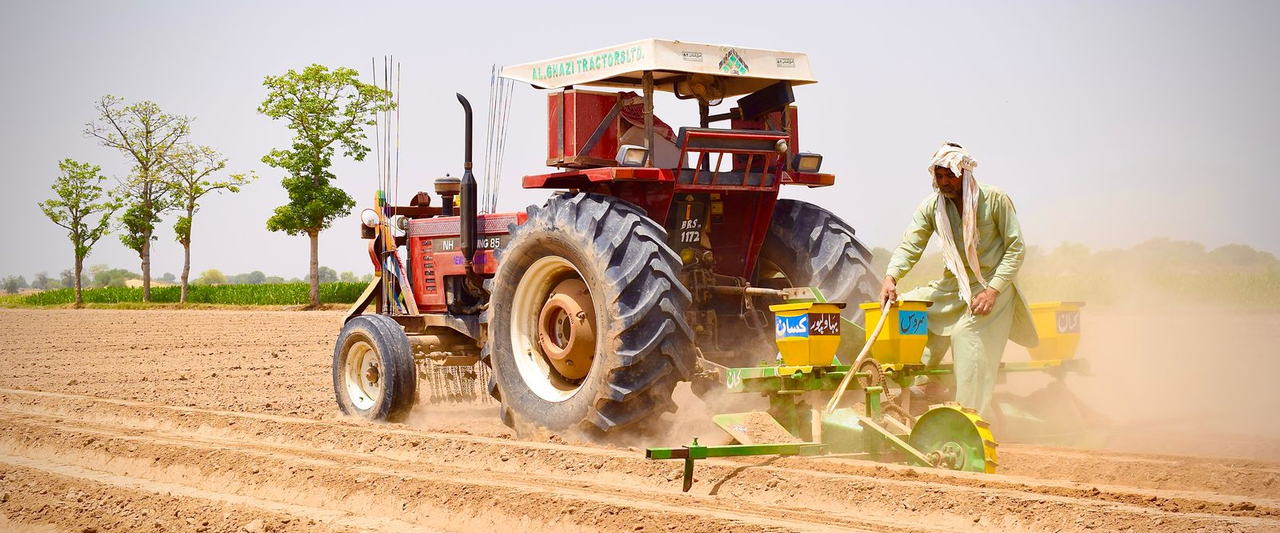
Rabi Sowing Is 46 Per Cent Behind. The Input Demand Has Not Vanished — It Has Compressed.
On 30 October, rabi sowing stood at 3.76 million hectares. A year ago, farmers had covered 6.90 million hectares. The shortfall is 45.6 per cent, and only 5.8 per cent of the season's normal 64.52 million hectares is in the ground. As a demand signal, that looks like a season collapsing. Against the crop calendar, it says something different: nearly the whole season's seed, fertiliser and crop-protection demand is still ahead, now to move in a few November weeks instead of spreading across two months. For input companies, dealers and their lenders, the problem this rabi is timing, not volume.
The wheat window has barely opened
Wheat is the extreme line: 19,000 hectares sown, down 94.2 per cent from 334,000 hectares a year ago. The calendar softens it. Wheat is sown through October and November, with the main window opening in the first week of November. The crop covered 336 lakh hectares in 2025-26; the production target is 121 million tonnes for 2026-27, against last year's record 120.7 million tonnes. A 94 per cent gap on a crop whose main window has not yet opened is mostly arithmetic. It will either close fast in November or not at all, and the October print cannot say which.
Part of the delay is weather, and that part is not arithmetic: the southwest monsoon ended 13 per cent deficient per IMD figures cited by BusinessLine, with Punjab's rainfall deficit at 38 per cent and Rajasthan's at 22 per cent. A weak monsoon leaves less residual soil moisture, and wheat needs repeated irrigation after sowing. So two delays sit inside one headline number: a calendar delay that resolves itself, and a moisture delay that may not. Planning that treats the whole 45.6 per cent as one kind of lag gets the stocking decision wrong in both directions.
The pace doubled in a week. The gap widened anyway.
Look at the week, not the cumulative figure: as of 23 October, rabi sowing was 18.02 lakh hectares, against 28.26 lakh hectares a year earlier, wheat just 11,000 hectares against 27,000. Seven days later it had more than doubled, to 37.56 lakh hectares. Yet the year-on-year shortfall deepened over the same week, from roughly 36 per cent to 45.6 per cent, because last year's sowing accelerated harder than this year's did. That pattern breaks any supply plan built on the cumulative gap: the gap says demand is shrinking, the weekly additions say it is arriving faster than the network handles in late October.
Mustard has carried the season so far
What has been sown is mostly one crop. Mustard stands at 2.05 million hectares, down 46.2 per cent from 3.807 million, and makes up most of total oilseeds at 2.097 million hectares. Pulses are further behind — chana at 590,000 hectares, down 58.9 per cent, total pulses at 945,000 hectares, down 51.7 per cent — while rice, down only 3.8 per cent at 316,000 hectares, has nearly caught up and jowar is flat. The small bases move the other way: urad up 40 per cent, groundnut up 62 per cent, sunflower up 30 per cent. The unsown balance sits in wheat, chana and mustard, so the compressed demand, when it lands, lands on the seed and nutrient lines those three crops use.
| Rabi sowing by crop (hectares) | 2026-27 | 2025-26 | Change (%) |
|---|---|---|---|
| Wheat | 19,000 | 334,000 | −94.2 |
| Rice | 316,000 | 329,000 | −3.8 |
| Chana | 590,000 | 1,435,000 | −58.9 |
| Lentil | 110,000 | 214,000 | −48.5 |
| Urad | 29,000 | 21,000 | +39.7 |
| Total pulses | 945,000 | 1,956,000 | −51.7 |
| Jowar | 271,000 | 272,000 | −0.3 |
| Maize | 78,000 | 93,000 | −16.1 |
| Total coarse cereals | 378,000 | 422,000 | −10.4 |
| Mustard | 2,050,000 | 3,807,000 | −46.2 |
| Groundnut | 25,000 | 15,000 | +62.1 |
| Sunflower | 7,000 | 5,000 | +30.4 |
| Total oilseeds | 2,097,000 | 3,862,000 | −45.7 |
| Total rabi crops | 3,756,000 | 6,902,000 | −45.6 |
Source: Agriculture Ministry sowing data as of 30 October 2026, reported by Informist. Farmioc.
National stock comfort is not district stock
On fertiliser supply, the season starts strong: the Fertiliser Secretary told the annual Rabi conference the opening stock on 1 October will be the highest in three years. The cost of holding that position has climbed sharply: the per-bag subsidy burden has risen from ₹1,350 to ₹2,775 for urea (45 kg) and ₹2,102 to ₹3,523 for DAP (50 kg) on higher global prices; the total subsidy this fiscal may exceed ₹3 lakh crore. None of that puts a bag in a specific district in the week its wheat goes in. National stock is a balance-sheet comfort; district availability in a compressed window is a logistics test — rake placement, warehouse positioning and dealer lifting at roughly twice the usual weekly rate. A season can be well stocked in aggregate and still run short in individual markets for ten days at a time — and ten days is the sowing window. That risk sits with distributors and their working capital.
Sales data just became a weaker demand signal
There is a second measurement problem, new this year. Under the Framework for Fertiliser Sales pilot across 222 districts in 29 states and Union Territories during Kharif 2026, recorded fertiliser sales fell 28 per cent, saving ₹1,470 crore. But buyers went up, to 46.97 lakh farmers from 44.55 lakh, while volume dropped to 13.35 lakh tonnes from 18.30 lakh tonnes. More farmers bought; each bought less, because eligibility is tied to landholding and the crop selected. Punjab did not implement the pilot and Madhya Pradesh discontinued it after farmer protests, so the map of where sales data still means what it used to is uneven too.
For territory planning, the consequence is direct: in pilot districts, a 28 per cent fall in recorded sales is not a 28 per cent fall in demand — it is partly a change in how a bag gets counted and who may buy how much. Cutting a pilot district's rabi allocation because its Kharif line fell means answering an accounting change as if it were an agronomic one. Sales data there now needs a second series beside it — sowing pace, buyer counts, crop mix — before it works as a demand proxy.
What to watch in November
Three things. First, the weekly sowing additions, not the cumulative gap: if November adds area at last year's weekly rate, the compression resolves into a short, intense selling season; if they add at the late-October rate, acreage itself is at risk, and second-round demand, top-dressing included, shrinks with it. Second, district-level fertiliser positioning ahead of the main wheat window — where national stock comfort either converts into availability or does not. Third, dealer credit: a compressed season means the same annual offtake funded over fewer weeks, and lenders should expect the peak, not the average, to be the binding number. The season has not shrunk. It has been squeezed into a shorter corridor, and firms that read the weekly pace early will be stocked in the right districts when it moves.
Farmioc's DataStore holds the district-level crop, weather and price series that let an input firm or a lender track that weekly pace district by district, instead of reading the season off one national headline.